
Պատկեր:USDebt.png
Սկզբնական նիշք (744 × 1004 փիքսել, նիշքի չափը՝ 53 ԿԲ, MIME-տեսակը՝ image/png)

|
Please translate the English parts of this template into Armenian.
Գոյություն ունի այս պատկերի վեկտորային տարբերակը ("SVG"): Եթե այն իր ռաստրային տարբերակից ավելի որակյալ է, ապա գերադասելի է նրա օգտագործումը: File:USDebt.png → File:USdebt.svg
Վեկտորային գրաֆիկայի մասին ավելին իմանալու համար կարող եք կարդալ պատկերների փոխադրման մասին SVG ֆորմատի: Նաև մատչելի են տեղեկություններ SVG ֆորմատի աջակցման մասին ՄեդիաՎիքիյում: |
 |
Ամփոփում
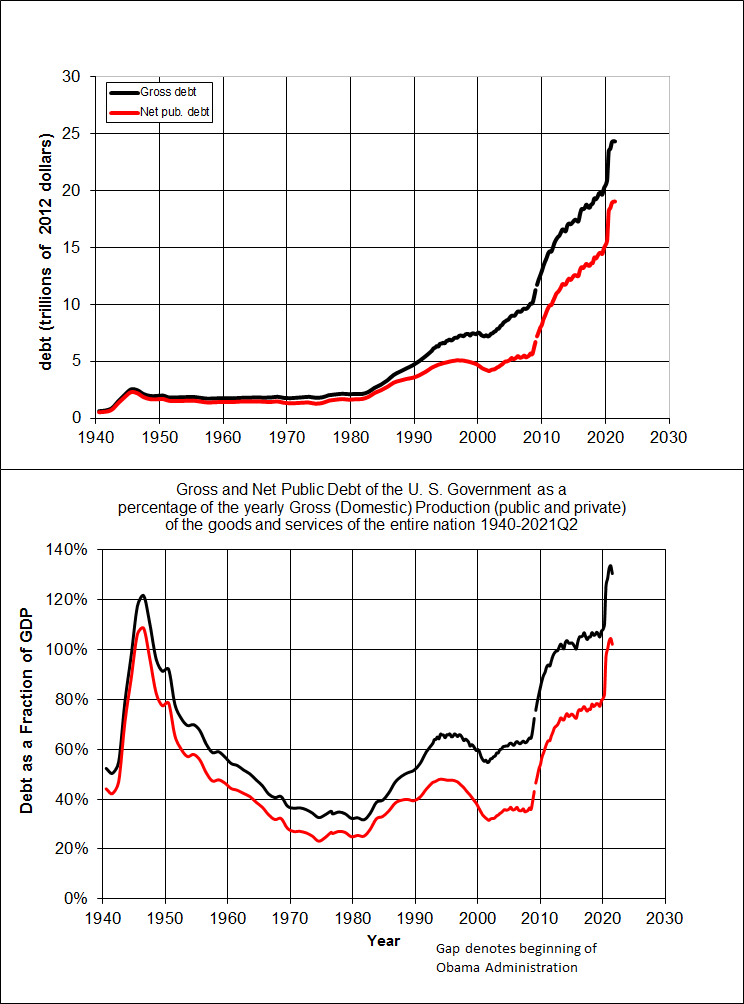
| Նկարագրում | U.S. debt from 1940 to 2010. Red lines indicate the Debt Held by the Public (net public debt) and black lines indicate the Total Public Debt Outstanding (gross public debt), the difference being that the gross debt includes that held by the federal government itself. The second panel shows the two debt figures as a percentage of U.S. GDP (dollar value of U.S. economic production for that year). The top panel is deflated so every year is in 2010 dollars. |
| Թվական | |
| Աղբյուր |
United States Government Originally uploaded by O18 (talk) to en:Wikipedia (log). |
| Հեղինակ | en:User:O18 |
| Իրավունքներ (Նիշքի վերաօգտագործումը) |
Այս նիշքը հասանելի է Creative Commons Attribution-Share Alike 3.0 Unported արտոնագրի ներքո:
|
Data sources
Data for 1940-2010 are available from the United States Government at http://www.whitehouse.gov/omb/budget/Historicals archive copy at the Wayback Machine
- Debt (nominal and percentage of GDP): table 7.1
- Deflator (composite outlay deflator): table 1.3 or 10.1
Table description:
- year: fiscal year
- gross federal debt dollars: (nominal) gross federal debt (millions)
- total public dollars: (nominal) federal debt held by the public, ie, net of that held by federal govt (millions)
- deflator: composite outlay deflator (indexed to 2005)
- gross federal debt gdp: gross federal debt over fiscal year GDP (on same nominal/real basis)
- total public gdp: federal debt held by the public over fiscal year GDP (on same nominal/real basis)
Evidence against bias:
- the gross federal debt dollars series agrees well with the Oct, 23 AP report ("U.S. Debt Past $1 Trillion") that the debt first passed 1 Trillion dollars that day.
- The gross federal debt gdp in 2007 is the ratio of the nominal GDP from CIA fact book in 2007 over the nominal debt from table 7.1 in the reference.
Tabled data
This data tabled directly from the source (Presidents FY2012 budget). Note: deflators are applied when graphing in the code below, and it is deflated to the stated year (now 2010).
"year","gross.federal.debt.dollars","total.public.dollars","deflator","gross.federal.debt.gdp","total.public.gdp"
1940,50696,42772,0.0804,52.4,44.2
1941,57531,48223,0.0836,50.4,42.3
1942,79200,67753,0.0936,54.9,47.0
1943,142648,127766,0.1026,79.1,70.9
1944,204079,184796,0.0949,97.6,88.3
1945,260123,235182,0.0905,117.5,106.2
1946,270991,241861,0.0906,121.7,108.6
1947,257149,224339,0.1000,110.3,96.2
1948,252031,216270,0.1058,98.4,84.5
1949,252610,214322,0.1024,93.2,79.1
1950,256853,219023,0.1064,94.1,80.2
1951,255288,214326,0.1047,79.6,66.9
1952,259097,214758,0.1041,74.3,61.6
1953,265963,218383,0.1124,71.3,58.6
1954,270812,224499,0.1163,71.8,59.5
1955,274366,226616,0.1203,69.5,57.4
1956,272693,222156,0.1263,63.8,52.0
1957,272252,219320,0.1327,60.5,48.7
1958,279666,226336,0.1405,60.7,49.2
1959,287465,234701,0.1460,58.5,47.8
1960,290525,236840,0.1466,56.1,45.7
1961,292648,238357,0.1507,55.1,44.9
1962,302928,248010,0.1511,53.4,43.7
1963,310324,253978,0.1579,51.8,42.4
1964,316059,256849,0.1599,49.4,40.1
1965,322318,260778,0.1620,46.9,38.0
1966,328498,263714,0.1658,43.6,35.0
1967,340445,266626,0.1700,41.9,32.8
1968,368685,289545,0.1765,42.5,33.4
1969,365769,278108,0.1881,38.6,29.3
1970,380921,283198,0.1991,37.6,28.0
1971,408176,303037,0.2133,37.8,28.1
1972,435936,322377,0.2283,37.0,27.4
1973,466291,340910,0.2412,35.7,26.1
1974,483893,343699,0.2621,33.6,23.9
1975,541925,394700,0.2889,34.7,25.3
1976,628970,477404,0.3117,36.2,27.5
1977,706398,549104,0.3371,35.8,27.8
1978,776602,607126,0.3588,35.0,27.4
1979,829467,640306,0.3902,33.2,25.6
1980,909041,711923,0.4318,33.3,26.1
1981,994828,789410,0.4789,32.6,25.8
1982,1137315,924575,0.5136,35.2,28.6
1983,1371660,1137268,0.5393,39.9,33.1
1984,1564586,1306975,0.5675,40.7,34.0
1985,1817423,1507260,0.5868,43.9,36.4
1986,2120501,1740623,0.6020,48.1,39.5
1987,2345956,1889753,0.6210,50.5,40.6
1988,2601104,2051616,0.6398,51.9,41.0
1989,2867800,2190716,0.6634,53.1,40.6
1990,3206290,2411558,0.6840,55.9,42.1
1991,3598178,2688999,0.7162,60.7,45.3
1992,4001787,2999737,0.7436,64.1,48.1
1993,4351044,3248396,0.7637,66.1,49.3
1994,4643307,3433065,0.7780,66.6,49.2
1995,4920586,3604378,0.7992,67.0,49.1
1996,5181465,3734073,0.8184,67.1,48.4
1997,5369206,3772344,0.8356,65.4,45.9
1998,5478189,3721099,0.8436,63.2,43.0
1999,5605523,3632363,0.8554,60.9,39.4
2000,5628700,3409804,0.8767,57.3,34.7
2001,5769881,3319615,0.8988,56.4,32.5
2002,6198401,3540427,0.9135,58.8,33.6
2003,6760014,3913443,0.9375,61.6,35.6
2004,7354673,4295544,0.9644,62.9,36.8
2005,7905316,4592229,1.0000,63.6,36.9
2006,8451350,4828972,1.0354,64.0,36.6
2007,8950744,5035129,1.0642,64.6,36.3
2008,9986082,5803050,1.1031,69.7,40.5
2009,11875851,7544707,1.1085,85.2,54.1
2010,13528807,9018941,1.1218,94.2,62.8
2011,14764222,10128206,1.1525,98.7,67.7
2012,16050921,11281131,1.175343,100.1,70.4
2013,16719434,11982713,1.190529,101.2,72.6
2014,17794483,12779899,1.208930,103.3,74.2
2015,18120106,13116692,1.216690,101.2,73.3
2016,19539445,14167725,1.226666,106.1,77.0
July 29, 2021 Comprehensive revision: debt from U.S. Treasury website, GDP and deflators from BEA table, Debt/GDP ratio calculated from foregoing
Program
The image was made with R using the following code after setting the working directory properly.
#setwd("~/")  # <- you have to change this to a folder on your computer
dat <- read.csv("debt.txt") # <- you have to put the above data as debt.txt in the folder
bitmap(file="USDebt.png",type="png256",width=6,height=7,res=300,pointsize=14)
par(mfrow=c(2,1))
par(mar=c(2,3.5,0.1,1))
par(las=1)
par(yaxs="i")
par(mgp=c(2.1,0.6,0))
dat$deflator <- dat$deflator / dat$deflator[dat$year==2010]
plot(range(dat$year),range(1.04 * c(0,dat$gross.federal.debt.dollars/dat$deflator/1e6)),type="n",xlab="debt",ylab="debt (trillions of 2010 dollars)",lwd=3)
lines(dat$year,dat$gross.federal.debt.dollars/dat$deflator/1e6,lwd=3)


lines(dat$year,dat$total.public.dollars/dat$deflator/1e6,type="l",col="red",lwd=3)
legend("topleft",lwd=3,col=c("black","red"),legend=c("gross debt","public debt"),bty="n")
par(mar=c(2,3.5,0.1,1))
plot(range(dat$year),range(1.04 * c(0,dat$gross.federal.debt.gdp,dat$total.public.gdp)),type="n",xlab="year",ylab="debt as a % of gdp")
lines(dat$year,dat$gross.federal.debt.gdp,type="l",lwd=3)
lines(dat$year,dat$total.public.gdp,type="l",col="red",lwd=3)
dev.off()
Նիշքի պատմություն
Մատնահարեք օրվան/ժամին՝ նիշքի այդ պահին տեսքը դիտելու համար։
| Օր/Ժամ | Մանրապատկեր | Օբյեկտի չափը | Մասնակից | Մեկնաբանություն | |
|---|---|---|---|---|---|
| ընթացիկ | 22:19, 1 Օգոստոսի 2021 | | 744 × 1004 (53 ԿԲ) | ResidentScholar | Updated to 2021Q2 with July 29, 2021 Bureau of Economic Analysis comprehensive update |
| 03:08, 27 Հունիսի 2017 |  | 1800 × 2100 (39 ԿԲ) | O18 | updated data | |
| 17:53, 5 Ապրիլի 2012 |  | 1800 × 2100 (41 ԿԲ) | Pdbailey | ||
| 15:07, 14 Մարտի 2011 |  | 1800 × 2100 (40 ԿԲ) | Pdbailey | ||
| 15:05, 14 Մարտի 2011 |  | 1800 × 2100 (40 ԿԲ) | Pdbailey | ||
| 22:39, 26 փետրվարի 2011 |  | 1173 × 1443 (27 ԿԲ) | ResidentScholar~commonswiki | The previous version of this file had a legend saying 2009 deflator, but had data for a 2005 deflator. There was substantial inflation between 2005 and 2010, so the adjustment is quite noticeable: my point being that the price increases did not take pla | |
| 13:28, 31 Մարտի 2010 |  | 1800 × 2100 (40 ԿԲ) | Pdbailey | ||
| 23:58, 30 Մարտի 2010 |  | 1800 × 2100 (40 ԿԲ) | Pdbailey | ||
| 17:32, 23 Սեպտեմբերի 2009 |  | 1800 × 2100 (40 ԿԲ) | Pdbailey | Update to take comments into account | |
| 12:49, 19 Հունիսի 2009 |  | 1800 × 2100 (41 ԿԲ) | Nick Anfinsen | {{Information |Description===Data sources== Data for 1940-2007 are available from the United States Government * Debt (nominal and percentage of GDP): [http://www.whitehouse.gov/omb/budget/fy2009/pdf/hist.pdf], table 7.1 * Deflator (composite outlay defl |
Նիշքի օգտագործում
Հետևյալ 2 էջերը հղվում են այս նիշքին՝
Նիշքի համընդհանուր օգտագործում
Հետևյալ այլ վիքիները օգտագործում են այս նիշքը՝
- Օգտագործումը cs.wikipedia.org կայքում
- Օգտագործումը da.wikipedia.org կայքում
- Օգտագործումը en.wikipedia.org կայքում
- Օգտագործումը es.wikipedia.org կայքում
- Օգտագործումը et.wikipedia.org կայքում
- Օգտագործումը ms.wikipedia.org կայքում
- Օգտագործումը nl.wikipedia.org կայքում
- Օգտագործումը no.wikipedia.org կայքում
- Օգտագործումը sv.wikipedia.org կայքում
- Օգտագործումը tr.wikipedia.org կայքում
- Օգտագործումը uz.wikipedia.org կայքում
- Օգտագործումը vi.wikipedia.org կայքում
- Օգտագործումը zh.wikipedia.org կայքում