
Պատկեր:Demographic change in Sweden 1735-2000.png
Ավելի բարձր կետաչափով տարբերակ չկա։
Demographic_change_in_Sweden_1735-2000.png (652 × 415 փիքսել, նիշքի չափը՝ 7 ԿԲ, MIME-տեսակը՝ image/png)

|
This graph image could be re-created using vector graphics as an SVG file. This has several advantages; see Commons:Media for cleanup for more information. If an SVG form of this image is available, please upload it and afterwards replace this template with
{{vector version available|new image name}}.
It is recommended to name the SVG file “Demographic change in Sweden 1735-2000.svg”—then the template Vector version available (or Vva) does not need the new image name parameter. |
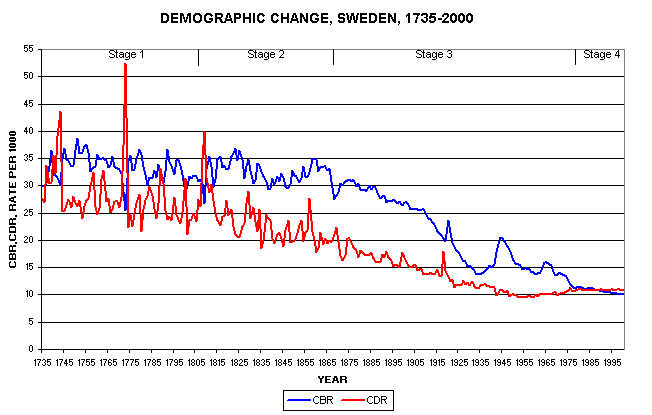
Graph showing demographic change in Sweden over the time period. A good example of a en:Demographic transition.
Taken with permission from [1]
This file is licensed under the Creative Commons Attribution 2.5 Generic license.
- Դուք ազատ եք՝
- կիսվել ստեղծագործությամբ – պատճենել, տարածել և փոխանցել այս աշխատանքը։
- վերափոխել – ադապտացնել աշխատանքը
- Պահպանելով հետևյալ պայմանները'
- հղում – Դուք պետք է նշեք հեղինակի (իրավատիրոջ) հղումը:
Original upload log
| Օր/Ժամ | Օբյեկտի չափը | Մասնակից | Մեկնաբանություն |
|---|---|---|---|
| 14 Հուլիս 2005, 09:13:33 | 652 × 415 (9835 bytes) | Komencanto (Քննարկում · ներդրում) | Graph showing demographic change in Sweden over the time period. A good example of a [[en:Demographic transition]]. Taken with permission from [http://www.uwmc.uwc.edu/geography/Demotrans/demtran.htm] {{cc-by-2.5}} |
Նիշքի պատմություն
Մատնահարեք օրվան/ժամին՝ նիշքի այդ պահին տեսքը դիտելու համար։
| Օր/Ժամ | Մանրապատկեր | Օբյեկտի չափը | Մասնակից | Մեկնաբանություն | |
|---|---|---|---|---|---|
| ընթացիկ | 18:14, 10 Դեկտեմբերի 2014 | | 652 × 415 (7 ԿԲ) | GifTagger | Bot: Converting file to superior PNG file. (Source: Demographic_change_in_Sweden_1735-2000.gif). This GIF was problematic due to non-greyscale color table. |
Նիշքի օգտագործում
Հետևյալ էջը հղվում է այս նիշքին՝
Նիշքի համընդհանուր օգտագործում
Հետևյալ այլ վիքիները օգտագործում են այս նիշքը՝
- Օգտագործումը bg.wikipedia.org կայքում
- Օգտագործումը bn.wikipedia.org կայքում
- Օգտագործումը cs.wikipedia.org կայքում
- Օգտագործումը da.wikipedia.org կայքում
- Օգտագործումը da.wikibooks.org կայքում
- Օգտագործումը en.wikipedia.org կայքում
- Օգտագործումը es.wikipedia.org կայքում
- Օգտագործումը fi.wikipedia.org կայքում
- Օգտագործումը fr.wikipedia.org կայքում
- Օգտագործումը ja.wikipedia.org կայքում
- Օգտագործումը ru.wikipedia.org կայքում
- Օգտագործումը sh.wikipedia.org կայքում
- Օգտագործումը sr.wikipedia.org կայքում
- Օգտագործումը sv.wikipedia.org կայքում
- Օգտագործումը uk.wikipedia.org կայքում