
Պատկեր:2017- Donald Trump veracity - composite graph.png

Սկզբնական նիշք (2775 × 1750 փիքսել, նիշքի չափը՝ 141 ԿԲ, MIME-տեսակը՝ image/png)

|
This graph image could be re-created using vector graphics as an SVG file. This has several advantages; see Commons:Media for cleanup for more information. If an SVG form of this image is available, please upload it and afterwards replace this template with
{{vector version available|new image name}}.
It is recommended to name the SVG file “2017- Donald Trump veracity - composite graph.svg”—then the template Vector version available (or Vva) does not need the new image name parameter. |
Ամփոփում
| Նկարագրում |
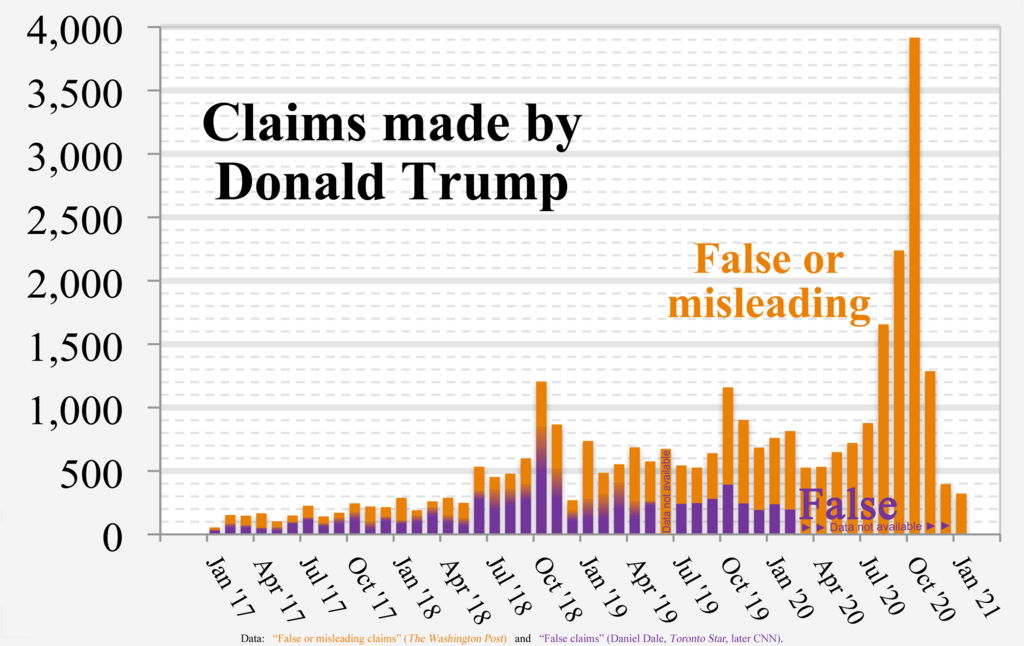
English: Chart of Donald Trump's “False or misleading claims” (The Washington Post) and “False claims” by Daniel Dale (Toronto Star, later CNN)
Technical details:
|
| Թվական | |
| Աղբյուր | Բեռնողի սեփական աշխատանք |
| Հեղինակ | RCraig09 |
| Այլ մեկնակերպներ |
 |
Source data
- Data used to form fact check from The Washington Post is in image description page for File:2017- Donald Trump - graph - false or misleading claims.png
- Data used to form Toronto Star / CNN graph is in collapsible text:
- Versions 1 through 4:
| Click at right to show/hide data for Toronto Star / CNN portions (center of "error bars" in Versions 1-4) |
|---|
|
Month False statements |
- Version 5+:
| Click at right to show/hide data for Toronto Star / CNN portions (below, inside, and above Gradient regions in Version 5) |
|---|
|
Each three of the following data items are "stacked" (violet, below gradient, below orange) to form a full-height column. Month MIN GRADIENT WashPost |
Արտոնագրում
- Դուք ազատ եք՝
- կիսվել ստեղծագործությամբ – պատճենել, տարածել և փոխանցել այս աշխատանքը։
- վերափոխել – ադապտացնել աշխատանքը
- Պահպանելով հետևյալ պայմանները'
- հղում – Դուք պետք է նշեք հեղինակի (իրավատիրոջ) հղումը:
- համանման տարածում – Եթե դուք ձևափոխում եք, փոխակերպում, կամ այս աշխատանքի հիման վրա ստեղծում եք նոր աշխատանք, ապա ձեր ստեղծածը կարող է տարածվել միայն նույն կամ համարժեք թույլատրագրով։
Նիշքի պատմություն
Մատնահարեք օրվան/ժամին՝ նիշքի այդ պահին տեսքը դիտելու համար։
| Օր/Ժամ | Մանրապատկեր | Օբյեկտի չափը | Մասնակից | Մեկնաբանություն | |
|---|---|---|---|---|---|
| ընթացիկ | 06:23, 9 փետրվարի 2021 | | 2775 × 1750 (141 ԿԲ) | RCraig09 | Version 16: Eliminate Oct 2016 as irrelevant date to include. Reduced filesize at tinypng.com |
| 06:08, 9 փետրվարի 2021 |  | 2775 × 1750 (140 ԿԲ) | RCraig09 | Version 15: Update to include final data for January 2021. Reduced filesize at tinypng.com. | |
| 07:00, 16 հունվարի 2021 |  | 2775 × 1750 (520 ԿԲ) | RCraig09 | Version 14: Update to include Washington Post data for Nov and Dec 2020 | |
| 23:32, 5 հունվարի 2021 |  | 2775 × 1750 (588 ԿԲ) | RCraig09 | Version 13: Updated to include Washington Post data through October 2020. | |
| 23:39, 20 Դեկտեմբերի 2020 |  | 2775 × 1750 (495 ԿԲ) | RCraig09 | Version 12: Update to include Washington Post data through end of September 2020. | |
| 07:24, 16 Նոյեմբերի 2020 |  | 2775 × 1750 (532 ԿԲ) | RCraig09 | Version 11: Updating graph to include exact value for August 2020 that no longer involves extrapolation for the last four days of the month. Washington Post added a few more days to their database. | |
| 22:28, 21 Հոկտեմբերի 2020 |  | 2775 × 1750 (532 ԿԲ) | RCraig09 | Version 10: Update to include Washington Post data for July and August 2020. Had to expand vertical scale to accommodate new high in data value (for August 2020). | |
| 06:43, 13 Հուլիսի 2020 |  | 2775 × 1750 (522 ԿԲ) | RCraig09 | Version 9: updated to include Washington Post data for June 2020. | |
| 06:00, 5 Հունիսի 2020 |  | 2775 × 1750 (515 ԿԲ) | RCraig09 | Version 8: Updating to include Washington Post data for April and May 2020 | |
| 20:29, 15 Ապրիլի 2020 |  | 2775 × 1750 (586 ԿԲ) | RCraig09 | Version 7: updated to include CNN data for Jan and Feb 2020 |
Նիշքի օգտագործում
Հետևյալ էջը հղվում է այս նիշքին՝
Նիշքի համընդհանուր օգտագործում
Հետևյալ այլ վիքիները օգտագործում են այս նիշքը՝
- Օգտագործումը ca.wikipedia.org կայքում
- Օգտագործումը en.wikipedia.org կայքում
- Օգտագործումը he.wikipedia.org կայքում
- Օգտագործումը ja.wikipedia.org կայքում
- Օգտագործումը pfl.wikipedia.org կայքում