
Պատկեր:Annual real food price indices.svg

Սկզբնական նիշք (SVG-նիշք, անվանապես 760 × 370 փիքսել, նիշքի չափը՝ 11 ԿԲ)
Ամփոփում
| Նկարագրում |
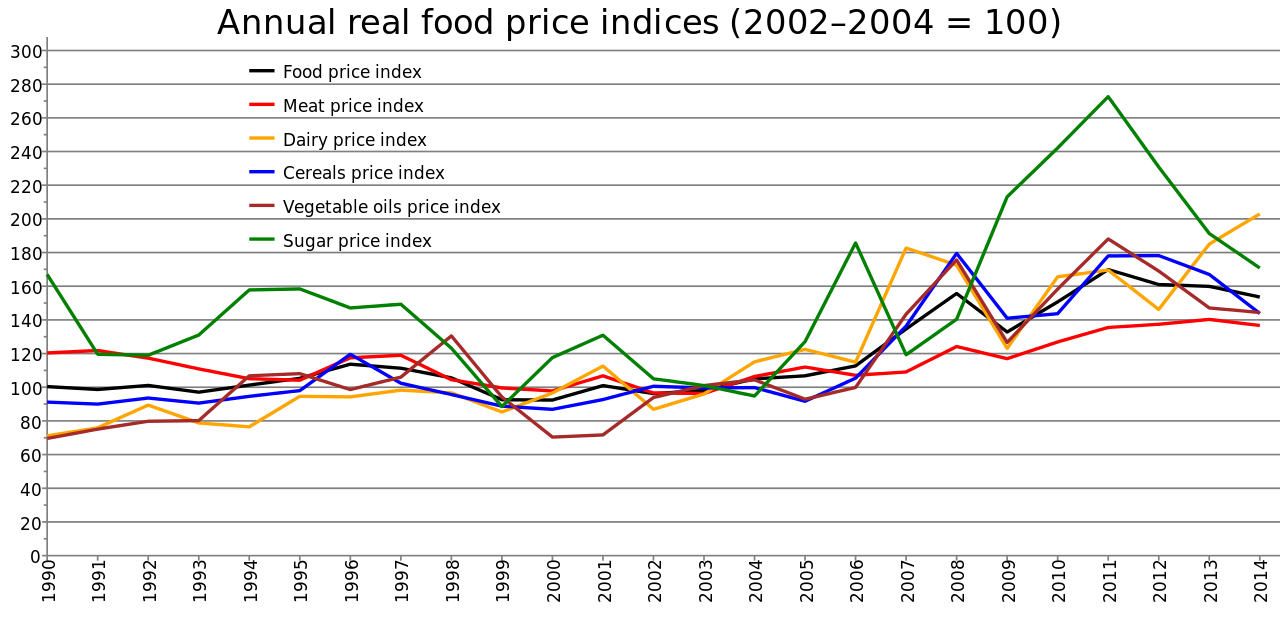
English: Source of data: http://www.fao.org/fileadmin/templates/worldfood/Reports_and_docs/Food_price_indices_data.xls
Food Price Index: Consists of the average of 5 commodity group price indices mentioned above, weighted with the average export shares of each of the groups for 2002-2004: in total 73 price quotations considered by FAO commodity specialists as representing the international prices of the food commodities noted are included in the overall index. Each sub-index is a weighted average of the price relatives of the commodities included in the group, with the base period price consisting of the averages for the years 2002-2004. Meat Price Index: Computed from average prices of four types of meat, weighted by world average export trade shares for 2002-2004. Commodities include two poultry products, three bovine meat products, three pig meat products, and one ovine meat product. There are 27 price quotations in total used in the calculation of the index. Where more than one quotation exists for a given meat type, a simple average is used. Prices for the two most recent months may be estimates and subject to revision. Dairy Price Index: Consists of butter, SMP, WMP, and cheese price quotations; the average is weighted by world average export trade shares for 2002-2004. Cereals Price Index: This index is compiled using the International Grains Council (IGC) wheat price index, itself an average of 10 different wheat price quotations, 1 maize export quotation and 16 rice quotations. The rice quotations are combined into three groups consisting of Indica, Japonica and Aromatic rice varieties. Within each variety, a simple average of the relative prices of appropriate quotations is calculated; then the average relative prices of each of the three varieties are combined by weighting them with their assumed (fixed) trade shares. Subsequently, the IGC wheat price index, after converting it to base 2002-2004, the relative prices of maize and the average relative prices calculated for the rice group as a whole are combined by weighting each commodity with its average export trade share for 2002-2004. Vegetable Oil Price Index: Consists of an average of 10 different oils weighted with average export trade shares of each oil product for 2002-2004. Sugar Price Index: Index form of the International Sugar Agreement prices with 2002-2004 as base. All indices have been deflated using the World Bank Manufactures Unit Value Index (MUV) rebased from 2005=100 to 2002-2004=100. |
| Թվական | |
| Աղբյուր | Բեռնողի սեփական աշխատանք |
| Հեղինակ | Nigelj |
Արտոնագրում
- Դուք ազատ եք՝
- կիսվել ստեղծագործությամբ – պատճենել, տարածել և փոխանցել այս աշխատանքը։
- վերափոխել – ադապտացնել աշխատանքը
- Պահպանելով հետևյալ պայմանները'
- հղում – Դուք պետք է նշեք հեղինակի (իրավատիրոջ) հղումը:
- համանման տարածում – Եթե դուք ձևափոխում եք, փոխակերպում, կամ այս աշխատանքի հիման վրա ստեղծում եք նոր աշխատանք, ապա ձեր ստեղծածը կարող է տարածվել միայն նույն կամ համարժեք թույլատրագրով։
Նիշքի պատմություն
Մատնահարեք օրվան/ժամին՝ նիշքի այդ պահին տեսքը դիտելու համար։
| Օր/Ժամ | Մանրապատկեր | Օբյեկտի չափը | Մասնակից | Մեկնաբանություն | |
|---|---|---|---|---|---|
| ընթացիկ | 22:34, 19 Մարտի 2014 | | 760 × 370 (11 ԿԲ) | Nigelj | Tweak legend and description |
| 22:22, 19 Մարտի 2014 |  | 760 × 370 (11 ԿԲ) | Nigelj | Simplify CSS hoping that the Commons renderer can cope this time | |
| 22:05, 19 Մարտի 2014 |  | 760 × 370 (11 ԿԲ) | Nigelj | User created page with UploadWizard |
Նիշքի օգտագործում
Հետևյալ էջը հղվում է այս նիշքին՝
Նիշքի համընդհանուր օգտագործում
Հետևյալ այլ վիքիները օգտագործում են այս նիշքը՝
- Օգտագործումը ar.wikipedia.org կայքում
- Օգտագործումը en.wikipedia.org կայքում
- Օգտագործումը nl.wikipedia.org կայքում
- Օգտագործումը vi.wikipedia.org կայքում