
Պատկեր:CO2 emission pie chart.svg

Սկզբնական նիշք (SVG-նիշք, անվանապես 540 × 540 փիքսել, նիշքի չափը՝ 76 ԿԲ)
Ամփոփում
| Նկարագրում |
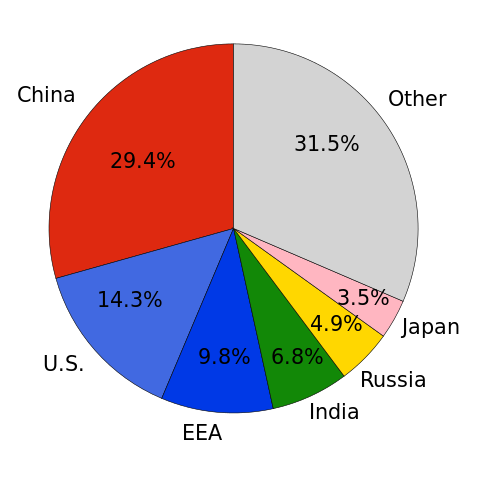
Català: Emissions globals de gasos CO2 l'any 2015 per país.
English: Global CO2 gas emissions in the year 2015 by country. |
|||
| Թվական | ||||
| Աղբյուր | Բեռնողի սեփական աշխատանք | |||
| Հեղինակ | Árni Dagur | |||
| Իրավունքներ (Նիշքի վերաօգտագործումը) |
|
|||
| Այլ մեկնակերպներ |
File:CO2 emission pie chart.svg has 3 translations.
Other related versions:[]
|
|||
| SVG genesis | Այս մասշտաբավորելի վեկտորային գրաֆիկայի նիշքի ելակետային կոդը վավեր է. Սա վեկտոր գրաֆիկական պատկեր է ստեղծված է եղել Matplotlib օգնությամբ: . | |||
| Ելակետային կոդ | Python code#Very slight changes were made in a text editor.
import matplotlib.pyplot as plt
print('Styles:', plt.style.available)
plt.rcdefaults()
plt.style.use('ggplot')
plt.rcParams['font.size'] = 19
plt.rcParams['patch.edgecolor'] = 'black'
plt.rcParams['lines.linewidth'] = 1
plt.figure(figsize=[6,6])
labels = ['China', 'USA', 'EEA', 'India', 'Russia', 'Japan', 'Other']
sizes = [29.3641757, 14.27217116, 9.814753272, 6.774059821, 4.858885975, 3.457132848, 31.458821414]
colours = ['#de2910', 'royalblue', '#0039e6', '#128807', 'gold', '#ffb6c1', 'lightgrey']
angle = 90
explode = (0, 0, 0, 0, 0, 0, 0)
# ^-- Change this to 0.1 for an explosion effect.
patches, texts, autotexts = plt.pie(sizes, explode=explode, colors=colours, autopct='%1.1f%%', pctdistance=0.815, labels=labels, labeldistance=1.1, shadow=False, startangle=angle)
for at in autotexts:
at.set_fontsize(16.21)
plt.axis('equal')
plt.tight_layout()
plt.gca().set_position([0, 0, 1, 1])
plt.gcf().subplots_adjust(bottom=0.15)
plt.savefig('co2_emission_pie_chart.svg')
|


|
Այս SVG ֆայլ օգտագործում է զետեղված տեքստ, որը կարելի է հեշտ թարգմանել ձեր լեզվի վրա using [toolforge:svgtranslate/File:CO2_emission_pie_chart.svglink this automated tool]: Իմացեք ավելին: You can also download it and translate it manually using a text editor. |
This file is translated using SVG For most Wikipedia projects, you can embed the file normally (without a To translate the text into your language, you can use the SVG Translate tool. Alternatively, you can download the file to your computer, add your translations using whatever software you're familiar with, and re-upload it with the same name. You will find help in Graphics Lab if you're not sure how to do this. |
(Data source: Emission Database for Global Atmospheric Research)
Please feel free to change the colours and update this image.
Արտոնագրում
| This file is made available under the Creative Commons CC0 1.0 Universal Public Domain Dedication. | |
| The person who associated a work with this deed has dedicated the work to the public domain by waiving all of their rights to the work worldwide under copyright law, including all related and neighboring rights, to the extent allowed by law. You can copy, modify, distribute and perform the work, even for commercial purposes, all without asking permission.
|
Նիշքի պատմություն
Մատնահարեք օրվան/ժամին՝ նիշքի այդ պահին տեսքը դիտելու համար։
| Օր/Ժամ | Մանրապատկեր | Օբյեկտի չափը | Մասնակից | Մեկնաբանություն | |
|---|---|---|---|---|---|
| ընթացիկ | 00:11, 31 հունվարի 2024 | | 540 × 540 (76 ԿԲ) | Manlleus | File uploaded using svgtranslate tool (https://svgtranslate.toolforge.org/). Added translation for es. |
| 00:02, 31 հունվարի 2024 |  | 540 × 540 (62 ԿԲ) | Manlleus | File uploaded using svgtranslate tool (https://svgtranslate.toolforge.org/). Added translation for ca. | |
| 23:59, 30 հունվարի 2024 |  | 540 × 540 (37 ԿԲ) | Manlleus | fixed text labels for translation | |
| 04:17, 8 Հունիսի 2017 |  | 540 × 540 (54 ԿԲ) | Illegitimate Barrister | Centering. | |
| 04:15, 8 Հունիսի 2017 |  | 540 × 540 (36 ԿԲ) | Illegitimate Barrister | WP:NOTUSA | |
| 01:34, 8 Հունիսի 2017 |  | 540 × 540 (30 ԿԲ) | ArniDagur | fixed wrong upload | |
| 01:32, 8 Հունիսի 2017 |  | 540 × 540 (30 ԿԲ) | ArniDagur | lines made black and smaller, font size increased, general improvements | |
| 00:41, 8 Հունիսի 2017 |  | 720 × 540 (30 ԿԲ) | ArniDagur | made font bigger | |
| 00:18, 8 Հունիսի 2017 |  | 720 × 540 (30 ԿԲ) | ArniDagur | User created page with UploadWizard |
Նիշքի օգտագործում
Հետևյալ 5 էջերը հղվում են այս նիշքին՝
Նիշքի համընդհանուր օգտագործում
Հետևյալ այլ վիքիները օգտագործում են այս նիշքը՝
- Օգտագործումը bn.wikipedia.org կայքում
- Օգտագործումը ca.wikipedia.org կայքում
- Օգտագործումը ckb.wikipedia.org կայքում
- Օգտագործումը cy.wikipedia.org կայքում
- Օգտագործումը da.wikipedia.org կայքում
- Օգտագործումը en.wikipedia.org կայքում
- Օգտագործումը es.wikipedia.org կայքում
- Օգտագործումը fr.wikipedia.org կայքում
- Օգտագործումը ha.wikipedia.org կայքում
- Օգտագործումը hu.wikipedia.org կայքում
- Օգտագործումը ig.wikipedia.org կայքում
- Օգտագործումը it.wikipedia.org կայքում
- Օգտագործումը ka.wikipedia.org կայքում
- Օգտագործումը ms.wikipedia.org կայքում
- Օգտագործումը or.wikipedia.org կայքում
- Օգտագործումը pt.wikipedia.org կայքում
- Օգտագործումը ro.wikipedia.org կայքում
- Օգտագործումը ru.wikipedia.org կայքում
- Օգտագործումը ru.wikinews.org կայքում
- Օգտագործումը so.wikipedia.org կայքում
- Օգտագործումը te.wikipedia.org կայքում
- Օգտագործումը uk.wikipedia.org կայքում
- Օգտագործումը uz.wikipedia.org կայքում
- Օգտագործումը vi.wikipedia.org կայքում
- Օգտագործումը www.wikidata.org կայքում
- Օգտագործումը zh.wikipedia.org կայքում